 Process Explorer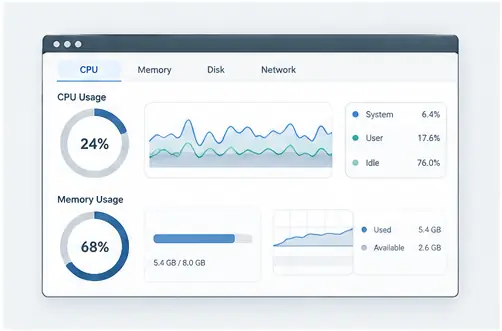
Read activity in context
CPU and memory values are snapshots of what the system is doing. A process can show a brief spike during a legitimate task, while a different process can remain moderately active for a long time. Use the numbers as signals that tell you where to look next.
CPU is about activity
High CPU usage means a process is consuming processor time. The useful question is why. An application may be rendering, compiling, indexing or performing another expected operation. If the usage remains high without an obvious reason, inspect the process and its child processes.
Memory needs a second look
Memory values describe how much memory is associated with a process, but a large number is not automatically a leak. Compare behavior over time and consider what the application is doing. A steadily increasing footprint combined with degraded behavior is a stronger troubleshooting clue than a single measurement.
Use the process tree
When resource usage is unexpected, the process tree helps identify whether the visible application is actually responsible or whether a helper process is doing the work. That distinction can save time during diagnosis.
Read resource activity with context
CPU and memory values are snapshots of activity, not diagnoses. A short CPU increase may be expected during a compile, render, update or indexing task. Memory usage also needs context: a large process can be normal for the application it belongs to. The useful question is whether the pattern matches what the application is supposed to be doing.
Practical checklist
Observe the process over time, compare it with child processes, note whether CPU remains elevated, inspect the process properties, and correlate the numbers with the visible symptom before taking action.