 Process Explorer
⌘
Process Tree
See parent and child processes in a hierarchy.
Explore running processes with more context than a basic task list. Follow process trees, inspect handles and loaded modules, search for open resources and understand how Windows applications fit together.
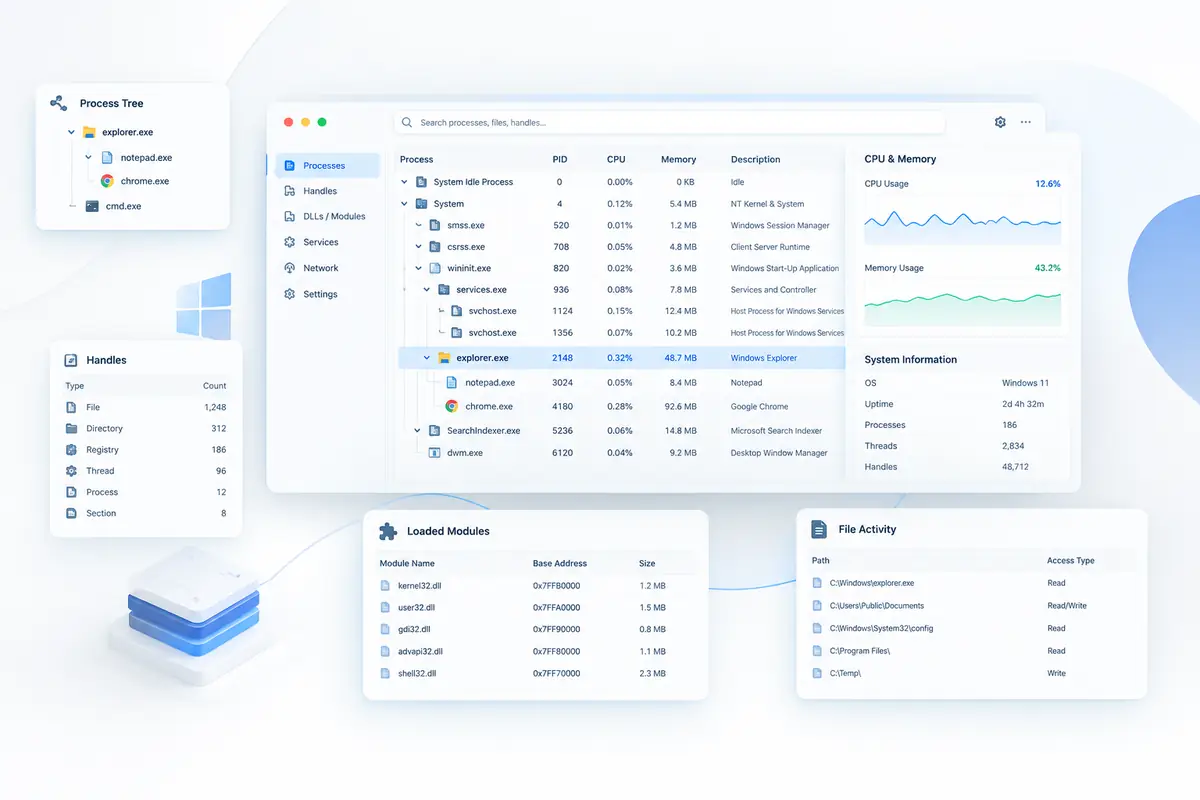
Process Explorer is designed for the moments when you need to know what a process is connected to, what it has loaded and what resources it has open.
See parent and child processes in a hierarchy.
Inspect identifiers and available process properties.
Find resources opened by a selected process.
Review loaded libraries and memory-mapped components.
Search for processes, handles and loaded modules.
Observe changing CPU and memory information.
Open focused details for a selected process.
A compact workflow built around inspection.
A flat list tells you what is running. A hierarchy adds context by showing which processes sit above and below the one you are investigating. That makes it easier to understand application launches, helper processes and background components.
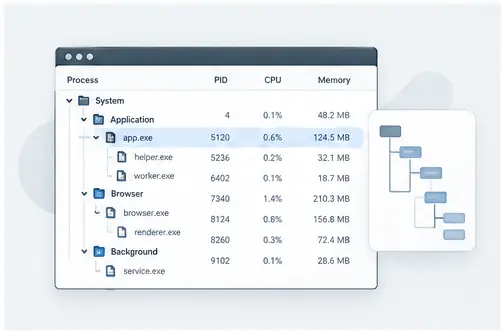
When a process is identified, the next question is often what it has open or loaded. Handles, files, DLLs and other properties can provide the missing context.
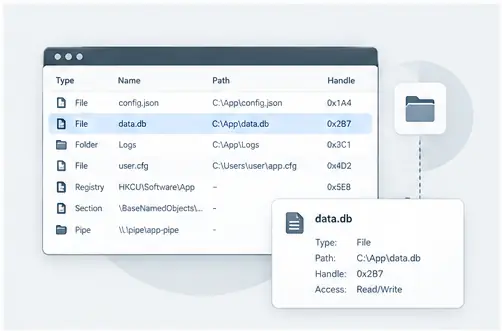
Trace a resource back to the process using it when a file appears locked or an application does not release something as expected.
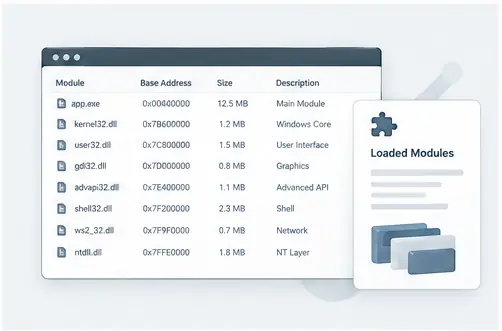
Review libraries and components loaded into a process when you need to understand application behavior or version issues.
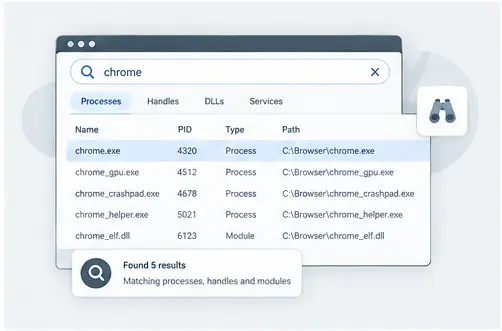
Start from the clue you already have and narrow a busy system to the process, handle or module connected to it.
A single number rarely explains a problem. Compare resource activity with the process tree and what the application is actually doing.
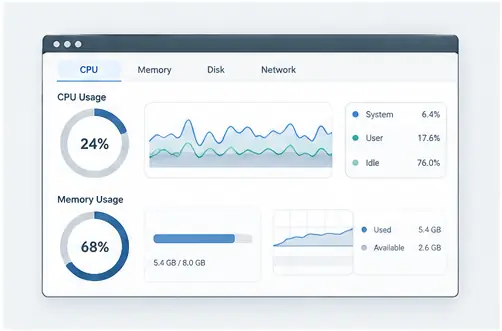
A short CPU spike can be normal during rendering, indexing, compilation or another active task. A persistent increase, repeated spikes or an unusual child process can justify deeper inspection.
Process Explorer becomes more useful when you move beyond a process name and inspect the relationships and resources around it.
Start with the active process list, then follow parent and child relationships to understand how a program was launched and what helper processes it created.
When a file, directory or other object is unexpectedly in use, inspect the handles associated with the process instead of guessing which application owns it.
Loaded modules add another layer of context. They can help explain application dependencies and are especially useful when investigating version or compatibility issues.
Search helps narrow a busy system to the process, handle or module connected to the clue you already have.
Resource values are most useful when viewed alongside process relationships and activity. Look for persistent patterns rather than reacting to one short spike.
Focused properties give you a closer view of the selected process and provide context before you decide what action, if any, is appropriate.
Process Explorer becomes most useful when a simple list of running programs is not enough. Instead of treating a process name as the whole story, you can follow its relationships and inspect the resources around it. That layered view makes routine troubleshooting more deliberate and gives developers, administrators and support teams a common way to describe what they found.
Start by identifying the active process, its visible name and its surrounding hierarchy. This helps separate an application from helper processes, background components and system activity that may appear alongside it.
When a file cannot be moved, replaced or deleted, the useful question is often which process has it open. Handle information can turn that symptom into a concrete lead for the next step of an investigation.
Applications can load many libraries during normal operation. Reviewing loaded modules can add context when you are comparing versions, diagnosing a compatibility issue or trying to understand what a process has brought into memory.
A high resource reading is a starting signal rather than a diagnosis. Look at the process, its parent and children, and the activity around the time of the spike before deciding whether the behavior needs action.
Search is valuable when you already have a clue such as a filename, handle, module or process. Narrowing the system to matching results can save time when many processes are active.
Seeing how processes connect helps explain why one application may launch several workers or why a background component remains after a visible window closes. Context is often the difference between guessing and verifying.
Use a repeatable sequence so each observation leads naturally to the next useful question.
Begin with something concrete: an application that is slow, a file that will not move, an unexpected process, or a resource spike. Record what you already know before changing anything.
Find the process connected to the symptom and check its name, relationship and visible properties. The goal is to establish context, not to make a conclusion from a name alone.
Move into handles, files, modules, child processes or resource activity based on the problem you are investigating. Each layer can answer a different question.
Confirm the evidence with more than one clue when possible. If you need to terminate, suspend or otherwise change a process, understand the impact before taking that action.
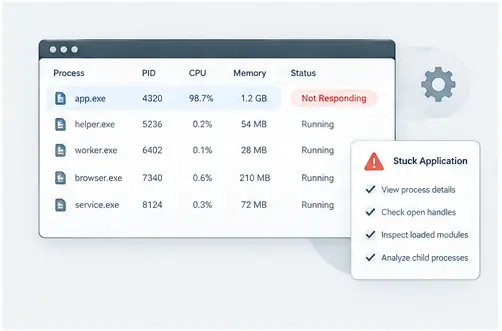
Move from a frozen application or resource issue to the process and related components behind it.
Understand service processes, background activity and resource usage on managed Windows systems.
Follow process creation and loaded modules when debugging application behavior.
Combine process paths, relationships and modules as evidence during careful investigation.
Start with the visible problem. Identify the relevant process, inspect its parent and child relationships, then move into handles, modules or resource activity that could explain the behavior.
Learn how parent and child processes relate, how to read a process hierarchy, and where the process tree fits into everyday troubleshooting.
Read guide →A practical guide to tracing open files and handles when Windows says a file is in use or an application refuses to release a resource.
Read guide →See how loaded modules add context to a running process and how module information can help when investigating application behavior.
Read guide →The supplied package is the Process Explorer v17.14 archive. Microsoft currently documents v17.14 for Windows 11 and Windows Server 2019 or later.
Get the supplied Process Explorer 17.14 ZIP package from the button on this page.
Extract the archive and launch the appropriate Process Explorer executable.
Start with the process tree, then inspect properties, handles or modules as needed.
A detailed process viewer is most helpful when it is used as part of a careful workflow. Start with a specific symptom, collect a few observations, and then inspect the process that is actually connected to that symptom. If a file is locked, search for the file or handle. If an application is unexpectedly busy, compare its process activity with its parent and child processes. If a component looks unfamiliar, inspect its location and loaded modules before making assumptions.
Process names can be duplicated, generic or unfamiliar. Combine the name with the executable path, parent relationship, visible properties and other evidence available in the process view. This produces a stronger picture than any single field on its own.
Inspection and intervention are different steps. Terminating or suspending a process can affect applications or system services, so first understand what the process is doing and whether the action is appropriate. For administrative changes, use the official Microsoft documentation as the authoritative reference.
For support work, document the symptom, the process you inspected, the evidence you found and the action you took. A repeatable sequence makes troubleshooting easier to explain and easier to revisit when the same issue appears again.
The nine guides on this site break common tasks into focused topics. Start with the process tree when you need context, then move into handles, modules, search, resource activity, services, troubleshooting or security-focused inspection as the problem requires.
Open one answer at a time for a quick reference.
Microsoft describes Process Explorer as a Sysinternals utility that shows active processes and provides information about handles and DLLs opened or loaded by processes.
The process tree shows parent and child relationships, helping you understand how applications and helper processes are connected.
Yes. Its handle search can help identify which process has a particular file or directory open.
Handles are references a process uses for objects such as files, directories, registry keys and other system resources. They can provide useful context when an application is holding something open.
They are libraries and other modules loaded into a process. Reviewing them can add context during debugging and troubleshooting, including DLL-version investigations.
Yes. Process Explorer includes search capabilities that can help locate processes with particular handles open or DLLs loaded.
No. It is a more detailed process-inspection utility. It is useful when you need process relationships, handles, loaded modules or focused inspection beyond a basic task list.
Microsoft's current documentation says to simply run Process Explorer (procexp.exe). The supplied download on this site is packaged as a ZIP archive.
Microsoft currently documents Process Explorer v17.14 for Windows 11 and Windows Server 2019 or later. Check the official Microsoft page for the latest compatibility details.
Start with the process tree, then move into the nine practical guides on this site for handles, modules, search, CPU and memory, troubleshooting, services, security analysis and process relationships.
Download the supplied Process Explorer 17.14 package and start with a detailed process view.